In the first part of this series, I shared our planning and query writing process—how our teams come together to plan each client project and the research that our analysts do in the beginning stage of each project. It was a lot! Now that you made it through part one, you'll sail through part two. Let's go!
Coding and Data Validation
Who’s Talking About You? What Are They Talking About?
Query down and executed—consider your data collected. Onto the (next) fun part! Who’s ready for data seg-men-taaaaaaa-tion? (Go back. Read that last sentence in an Oprah voice. Now you’re ready).
At this step, we have all the building blocks in place to start segmenting our data. While every project is custom (unique brand pillars for each campus, for example), there are a few go-to ways we tend to segment a campus’ dataset. For each segment, we categorize data with additional proprietary Boolean.
- Owned content—all data from the owned publishing accounts we painstakingly gathered.
- Earned content—any online data not generated by those owned accounts.
- Data from prospective students—whether they share that they’re considering visiting a campus, have toured, or applied, we identify and categorize this online data from prospective students.
- Data from admitted students—many students, once they’re admitted, share their joy online. They also tend to share other campuses they’re thinking about attending out of every one they’ve been accepted to! Segmenting this data for our clients allows them to strategically engage with admitted students when appropriate.
- Data from and about alumni—for the advancement team on campus we can quickly identify when alumni from your campus post on social media, author an article, or are mentioned in a news story.
- Athletics-related data—whether a school is Division 1 or 3, athletics data can account for up to (sometimes more than) 50 percent of a school’s online conversation. Often, if we analyze the conversation without athletic data, there’s a lot to uncover, and we better understand a school’s brand when athletics isn’t mentioned.
When we work with campuses that want to measure their unique brand drivers or themes in their online data, we build custom Boolean to help us segment appropriately. We work with our Client Success experts and campus professionals to bring a brand driver like “innovation” into a coded reality—breaking it down into key words, phrases, authors, programs, hashtags, etc., representing the brand driver appropriately so we can categorize a school’s data by each driver.
It’s Good to Be Clean
Query in place and data segmented, now we must pause our most adventurous of social listening expeditions and put on our thinking hats to prepare for data validation. What’s that? Yes, our thinking hat was on this entire time, but it’s best to scrunch it down on one’s head and ensure it’s securely on ahead of data validation. Losing it at this point would be a loss of grand proportions.
When you think of your Sonarian analyst heading into data validation, you can picture something like this:
 Our goal at this step is to remove any pesky mentions that just aren’t relevant to the school. We look for things like:
- Campus name or mascot used in the wrong context (think the “SNU” example from part one).
- Promotional spam from bars or restaurants.
- Content that purports to sell essays or writing services for students.
- Posts from individuals that use the campus’ email address, but the content of the post isn’t related to campus.
- And more.
Depending on the project goals, we may not want to exclude an item as irrelevant to the dataset. It all depends on what type of analysis we’re conducting and the research question we want to answer. Typically, an analyst spends anywhere between 2 and 10 hours validating data for a project in pursuit of creating a reasonably robust dataset that minimizes irrelevant mentions as much as possible.
Analysis and Insights
Why Are We Here, Anyway? Part II
Once the social listening research is executed, we come full circle to answer the question, why are we here and what are we doing? There’s a little bit of magic that happens here, too. The analyst has been completely immersed in the dataset (understanding key terms and hashtags, finding owned authors, and validating captured data), so they arrive at this stage with an idea of unique patterns that they want to explore as they begin their analysis of an institution’s online reputation.
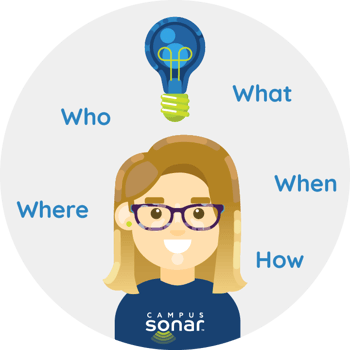
Analysis usually begins with a vision (set during the project kickoff) of general themes and metrics to explore to answer the project’s research question. Using that as a guideline, the analyst deep dives into the school’s dataset to answer the five Ws. Yes, I mean those five Ws that we learned about in grade school! Turns out they’re a handy tool to talk about our analysis approach at a high level.
Who is contributing to the conversation about campus? We observe the expected audiences who talk (admissions audiences, students, parents, etc.), and look for other unexpected audiences who bubble up in the online conversation.
What do they talk about? As far as breaking down what conversation looks like, we analyze what different audiences say as well as separately look at how much of the conversation is generated from the owned accounts we gathered versus non-owned (earned) accounts.
When do they talk about it? Between audiences, topics, owned and earned, we assess the frequency and volume of the data we collect.
Where do they talk about it? We analyze where conversation about the campus happens across content sources like social media, news, forums, reviews, blogs, and more, and cross-tab with audiences, topics, and other metrics.
And don’t forget how they talk about campus, too. Assessing sentiment and emotion for the online conversation as well as by audience, topic, and other metrics, is critical to understanding a campus’s perception. We leverage some artificial intelligence for automatic categorization of sentiment and emotion for our projects.
If you’ve been counting, I pulled a switcheroo and gave you how instead of the fifth W. That’s because why really represents the last key to our social listening journey. Up to this point, we’ve explored, analyzed, and assessed a campus’s online conversation a number of different ways and made many interesting observations.
Observations from data mean pretty charts and graphs, but not much else. It’s critical that throughout data validation and analysis that we continually ask ourselves why we’re observing certain phenomena or patterns in the data. Through this process, we comb through our observations and identify what’s not just interesting but also insightful. Some examples for Sampleton Northern University.
- Sentiment breakdown for the time period analyzed is greater than 20 percent positive for current students. Why? Digging deeper, one of the athletic teams won a coveted award.
- A brand pillar for Sampleton is “innovation.” However, the topical theme that arose in earned conversation (high in volume and consistent frequency) was coverage around the campus commitment to graduating students on time with low debt.
- Historically, say SNU was known for a particular program—they were the campus to go to for it—but online data collected from the SNU conversation reflects that many people are no longer satisfied with the flagship program.
These examples bring us halfway to an insight. Throughout the analysis process, the Research team works closely with our Client Success team to vet observations that may be valuable to investigate further. Strategists, like Rebecca Stapley, help our team understand the on-campus lens for our research so our analysis best answers the questions a campus has or explores areas of interest.
Together, we explore for Sampleton Northern, for example, whether it makes sense that the campus considers more branded athletic content since it resonates with a key audience. Or is there room to discuss how the perception of Sampleton as a value school impacts current branding and messaging for the university? Finally, the insights from our social listening research may spark on-campus conversation around the evolution of a once-renowned program with unfiltered feedback from key audience members online. From observation to insight, the Sonarians are always asking "is this reasonable?" and "does this make sense?" as related to several different contexts: for campus, in comparison to competitors and the general higher ed industry, based on online user demographics and behavior, and trends in social media.
Thanks for Coming Along
I hope you’ve found this social listening research journey enlightening. In true interwebs speak, here’s my TL;DR version of the series:
- Human analysts rock (especially the Sonarians). We make critical analytical decisions from research start to finish to ensure our analysis aligns with stated project goals and questions.
- Social listening can be used to monitor online conversation, and it’s also growing as a research method to collect, analyze, and develop insights from online data.
- You can’t conduct social listening research in a vacuum. We have to consider context (technology, industry, and human behavior trends) in order to develop custom, actionable insights.
- Data these days is easy to come by, but an expert lens to review that data is harder to find. The analytical and critical lens our analysts use in gathering and analyzing data is important to report findings and insights in a transparent and precise manner. Our internal partners, the Client Success team, have years of on-campus experience they lend to projects for additional analysis, robust insights, and tons of actionable recommendations inspired by social data.